Hussam Mohammed Alahmadi¹, Mohammad Alageeli¹, Yazeed Nashi Alaufi¹, Ziyad Hamzah Alahmadi², Adnan Saleh Alqarni³, Bader Musaad Alharbi¹, Ahmed Mohammed Aljabri¹, Ahmad Sultan Alamri¹, Nada Nayef Althbute⁴, Anas Abdulrahman Alshotiry³.Sociodemographic and Comorbidity Profiles of Crohn's Disease Versus Ulcerative Colitis: A Cross-Sectional Analysis of the 2023–2024 National Health Interview Survey. DawnMed Journal of Medical ScienceVolume 2, Issue 4:p: 38-47,2026.| DOI: 10.64039/djms.2026.2408
Sociodemographic and Comorbidity Profiles of Crohn's Disease Versus Ulcerative Colitis: A Cross-Sectional Analysis of the 2023–2024 National Health Interview Survey
Hussam Mohammed Alahmadi¹, Mohammad Alageeli¹, Yazeed Nashi Alaufi¹, Ziyad Hamzah Alahmadi², Adnan Saleh Alqarni³, Bader Musaad Alharbi¹, Ahmed Mohammed Aljabri¹, Ahmad Sultan Alamri¹, Nada Nayef Althbute⁴, Anas Abdulrahman Alshotiry³
Hussam Mohammed Alahmadi1, Mohammad Alageeli1, Yazeed Nashi Alaufi1, Ziyad Hamzah Alahmadi2, Adnan Saleh Alqarni3, Bader Musaad Alharbi1, Ahmed Mohammed Aljabri1, Ahmad Sultan Alamri1, Nada Nayef Althbute4, Anas Abdulrahman Alshotiry3
Affiliations
1 Internal Medicine Department, National Guard Hospital, Medina, Saudi Arabia.
2 College of Medicine, Taibah University, Medina, Saudi Arabia.
3 College of Medicine, University of Jeddah, Jeddah, Saudi Arabia.
4 College of Medicine, Taif University, Taif, Saudi Arabia.
Corresponding author
Hussam Mohammed Alahmadi
Internal Medicine Department, National Guard Hospital, Medina, Saudi Arabia.
Email: Hossam141950@gmail.com
Received: August 20, 2026 | Peer reviewed: October 1, 2026 | Accepted: October 4, 2026 | Published: October 14, 2026
Cite this article as
Alahmadi HM, Alageeli M, Alaufi YN, Alahmadi ZH, Alqarni AS, Alharbi BM, et al. Sociodemographic and Comorbidity Profiles of Crohn's Disease Versus Ulcerative Colitis: A Cross-Sectional Analysis of the 2023–2024 National Health Interview Survey. DawnMed Journal 2(4):38–47 https://doi.org/10.64039/djms.2026.2408
Background: Crohn's disease (CD) and ulcerative colitis (UC) are the two main subtypes of inflammatory bowel disease (IBD) and are usually explored as a single entity, obscuring the specific sociodemographic and comorbidity patterns of each entity.
Aim: To explore and compare the sociodemographic and chronic comorbidity patterns of United States (US) adults with a self-reported diagnosis of CD versus UC.
Methods: This nationally representative, cross-sectional analysis utilized data from the 2023–2024 National Health Interview Survey (NHIS) on a total of 62,151 adults. The diagnosis of CD (n = 351) and UC (n = 861) was established by self-reported physician diagnosis and analyzed as two independent case groups, with each group compared against respondents without that diagnosis. Weighted chi-square and t-tests were utilized to compare sociodemographic and comorbidity profiles; univariate and multivariate regression analyses (adjusted for age, sex, body mass index, smoking status, and univariably significant comorbidities) were used to estimate crude and adjusted odds ratios (aOR) for 15 comorbidities.
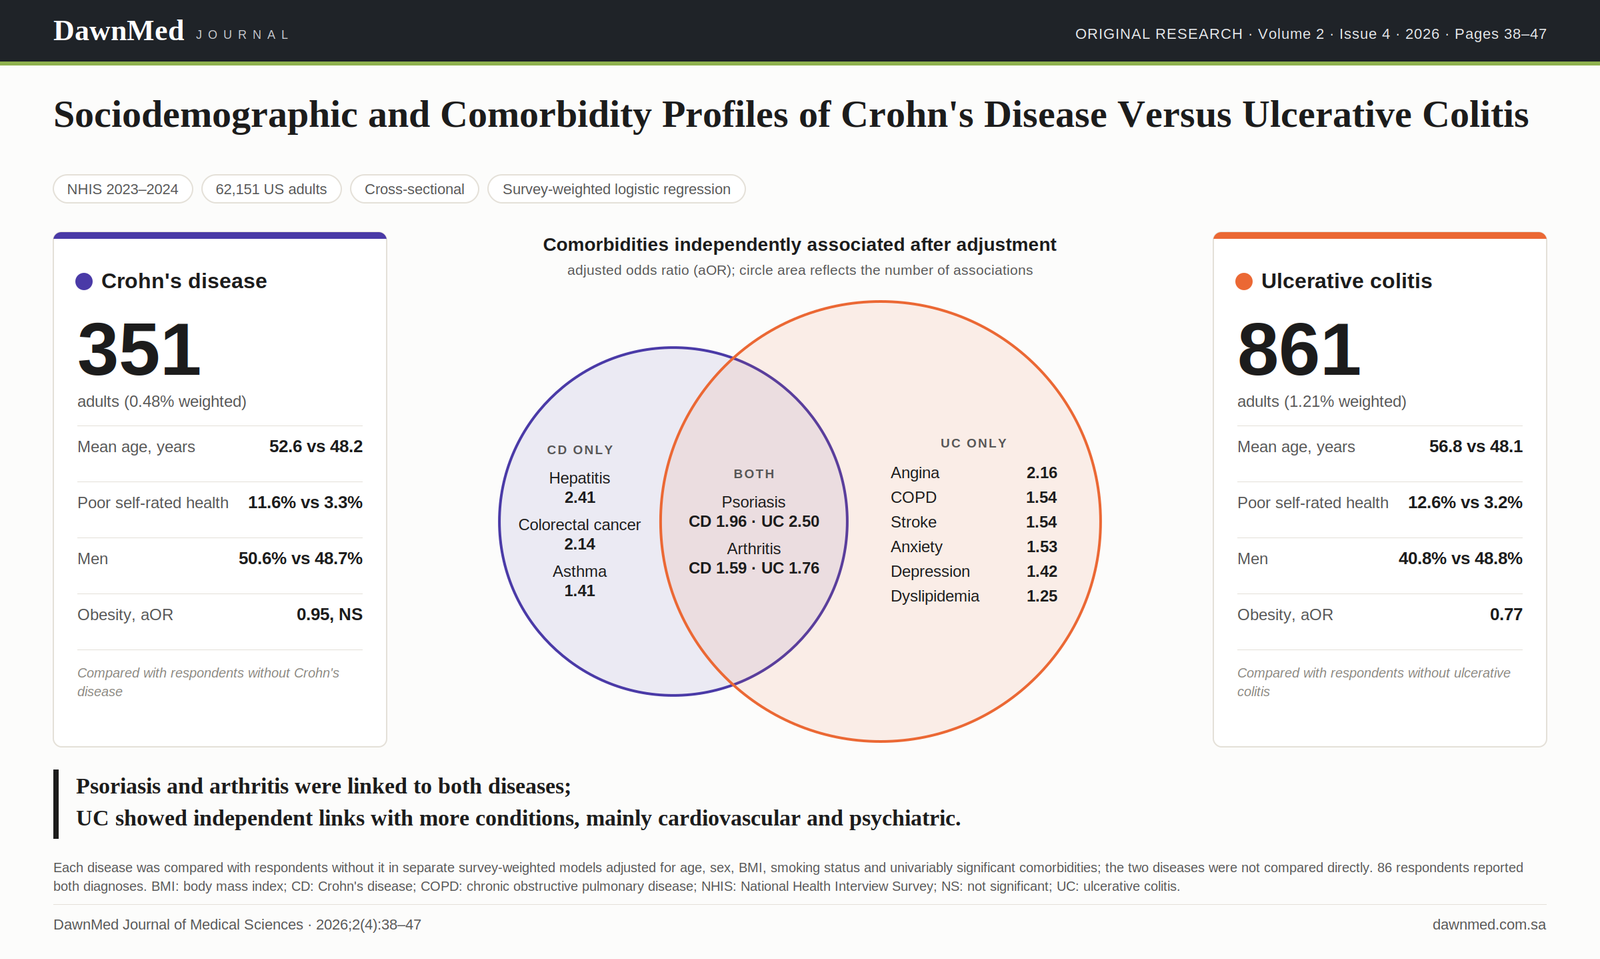
Results: In our sample, individuals with a diagnosis of CD and UC were significantly older than their comparators (52.6 ± 17.8 years and 56.8 ± 17.3 years, respectively, both p < 0.001). In unadjusted analysis, UC was significantly associated with female sex. Worse self-rated health and a significantly higher unadjusted prevalence of most comorbidities examined were reported by both groups. After multivariate adjustment, CD remained independently associated with asthma (aOR 1.41), psoriasis (aOR 1.96), hepatitis (aOR 2.41), arthritis (aOR 1.59), and colorectal cancer (aOR 2.14). UC, on the other hand, remained independently associated with eight comorbidities, including stroke, angina, dyslipidemia, psoriasis, depression, anxiety, arthritis, and chronic obstructive pulmonary disease (aORs 1.25–2.50). Obesity showed an independent association with lower odds of UC after adjustment (aOR 0.77), whereas the association with female sex was no longer significant (aOR 1.14).
Conclusions: Both CD and UC showed a significant presence of chronic comorbidity, but their adjusted comorbidity profiles differed, with UC showing independent associations with more comorbidities than CD, although the two diseases were not compared directly. These findings support the importance of disease-specific approaches rather than combined ones in the screening of IBD patients.
Introduction
CD and UC are the two main phenotypes of IBD, which are chronic, immune-mediated inflammatory disorders of the gastrointestinal tract. These two entities differ largely in anatomical distribution and inflammatory pattern: UC is confined to the colon and causes continuous mucosal inflammation, whereas CD is characterized by a transmural, discontinuous inflammatory pattern that can affect any segment of the gastrointestinal tract from the mouth to the anus [1]. These differences underlie substantial divergence in the nature of the disease and, increasingly, divergence in the sociodemographic and comorbidity profiles between both entities.
The worldwide burden of IBD has increased significantly, as across North America, Europe, and Oceania, the population prevalence of IBD has exceeded 0.3% [2]. In the US, national surveillance and administrative claims data have estimated that between 0.7% and 1.3% of adults have received a diagnosis of IBD, with variations in age, race, and ethnicity, being especially lower among Black, Asian, and Hispanic Americans compared to White Americans [3,4].
Beyond the gastrointestinal tract, both disease entities have been associated with increased burden of chronic diseases, as the national survey data exhibited higher rates of cardiovascular, respiratory, and psychiatric conditions among those with a diagnosis of IBD compared to the general population [5], with a large Danish national registry study demonstrating that CD and UC vary in the pattern and timing of extraintestinal and systemic comorbidities [6]. Psychiatric comorbid conditions are particularly prominent, with pooled prevalence estimates in meta-analysis suggesting that roughly one-quarter to one-third of individuals with IBD also exhibit anxious and depressive symptoms, with significantly higher odds of both among CD rather than UC patients [7].
Notwithstanding this evidence, most population-based studies conducted on the US population explore IBD as a single entity rather than distinguishing CD from UC. This limits the ability to establish well-documented disease-specific patterns for comorbidity and sociodemographic factors, which could help clinicians form targeted screening and management programs. Using nationally representative data from the 2023–2024 National Health Interview Survey, our study seeks to investigate and compare the sociodemographic characteristics and chronic comorbidity burden of individuals with a self-reported diagnosis of Crohn's disease and ulcerative colitis in the United States.
Subjects and Methods
Study design and data source
This is a cross-sectional study utilizing data from the 2023 and 2024 NHIS survey, which is a nationally representative, household-based survey that is conducted through a multistage probability sampling design to assess the health of non-institutionalized individuals in the United States, conducted by the National Center for Health Statistics (NCHS), Centers for Disease Control and Prevention (CDC) [8]. We pooled the only two NHIS survey years (2023 and 2024) that investigated the diagnosis of Crohn's disease and ulcerative colitis as separate entities apart from inflammatory bowel disease.
Study population and case ascertainment
In this study, the analytic sample included adults aged 18 years and older from both the 2023 and 2024 NHIS surveys (n = 62,151). Diagnosis of CD and UC was established using two independent NHIS questions asking participants whether or not a doctor or other health professional ever told them that they had Crohn's disease (variable CROHNSEV_A) or ulcerative colitis (variable ULCCOLEV_A). Thus, two independent case groups were established, CD cases (n = 351), compared with all respondents who never received a CD diagnosis (non-CD, n = 61,800), and UC cases (n = 861), compared with all respondents who never received a UC diagnosis (non-UC, n = 61,290). Because case ascertainment was done independently for each diagnosis, the two case groups were not mutually exclusive: 86 participants reported both diagnoses and were included in both comparative analyses.
Study variables
In our analysis, we included several sociodemographic and clinical variables, including age (AGEP_A), sex (SEX_A), race and ethnicity (RACEALLP_A: White only; Black/African American only; Asian only; American Indian/Alaska Native [AIAN] only; AIAN and any other race; other single and multiple races), body mass index (BMI) category (BMICAT_A: underweight, healthy weight, overweight, obese), self-rated general health status (PHSTAT_A: excellent, very good, good, fair, poor), life satisfaction (LSATIS4_A: very satisfied, satisfied, dissatisfied, very dissatisfied), and smoking status (never, former, or current smoker, derived from SMKEV_A and SMKNOW_A). Comorbidity variables included self-reported, physician-diagnosed history of stroke (STREV_A), angina (ANGEV_A), coronary heart disease (CHDEV_A), dyslipidemia (CHLEV_A), hypertension (HYPEV_A), diabetes mellitus (DIBEV_A), any cancer (CANEV_A), colorectal cancer specifically (COLRCCAN_A), asthma (ASEV_A), psoriasis (PSOREV_A), hepatitis (HEPEV_A), depression (DEPEV_A), anxiety (ANXEV_A), arthritis (ARTHEV_A), and chronic obstructive pulmonary disease (COPD) (COPDEV_A).
Statistical analysis
All analyses in this study accounted for the complex design of the NHIS, including annual sampling weights (WTFA_A), pseudo-strata (PSTRAT), and pseudo-primary sampling units (PPSU), in order to ensure nationally representative and appropriate variance estimates via Taylor series linearization. Sample sizes (unweighted, n) were reported along with survey-weighted percentages and 95% confidence intervals (CIs). Continuous data were summarized using weighted means and standard deviations, whereas categorical variables were summarized as unweighted frequencies with weighted proportions.
A comparison of sociodemographic, clinical, and comorbidity variables was established between those with a self-reported, previous diagnosis of CD and those without, and separately between those with a self-reported, previous diagnosis of UC and those without. For categorical variables, the comparison was conducted using survey-adjusted (design-based Wald) chi-square tests, whereas for continuous variables the comparison was conducted using survey-adjusted t-tests. Since the two conditions were assessed independently for all participants, the CD and UC groups were not mutually exclusive.
Univariate logistic regression models were used to estimate the unadjusted (crude) odds ratio (OR) with 95% CI for the association between sociodemographic factors and comorbidities and CD status, and separately UC status. Multivariate logistic regression models were then established to estimate the adjusted odds ratios with 95% CI for each condition. For each outcome, comorbidities significantly associated with the disease in the univariable analyses (p < 0.05) were included in the multivariable model, and age, sex, BMI, and smoking status were retained regardless of their univariable statistical significance. Item nonresponse (refused, not ascertained, or don't know) was handled by single imputation for all study variables except smoking status; respondents with missing smoking status (n = 1,794) were excluded from the multivariable models, leaving 60,357 participants. Results are presented as unadjusted (crude) and adjusted odds ratios with corresponding 95% CI and p-values and were visualized as forest plots. Statistical significance was defined as p < 0.05. Analyses were performed using Python version 3.12 within the Jupyter Notebook environment (Anaconda distribution).
Ethical considerations
This study is exempt from ethical approval due to its use of secondary, de-identified, publicly available data released by the NCHS for research use. Informed consent was obtained at the time of original data collection under the NCHS protocols.
Results
Study population
After combining the 2023–2024 NHIS surveys, a total of 62,151 sample adults were included in our study. The CD group included 351 (weighted 0.48%) individuals (reported ever being diagnosed with Crohn's disease), whereas the UC group included 861 (weighted 1.21%) individuals (reported ever being diagnosed with ulcerative colitis). Participants who reported both diagnoses (86 of the respondents) were retained in both case groups. Full comparisons are shown in Table 1.
Sociodemographic and clinical characteristics
In regard to age, participants with CD and UC were older on average than those without the respective diagnosis (52.6 ± 17.8 vs. 48.2 ± 18.6 years and 56.8 ± 17.3 vs. 48.1 ± 18.6 years, respectively, p < 0.001). For gender, there was no significant difference between CD and non-CD participants (50.6% vs. 48.7% male; p = 0.57), whereas UC participants were less likely to be males (40.8% male among UC vs. 48.8% among non-UC; p < 0.001). Distribution of race and ethnicity was shown to be significantly different across both diagnoses, most notably a higher percentage of individuals identifying as White only among both the CD (84.9% vs. 77.9% of non-CD; p = 0.03) and UC groups (86.3% vs. 77.9% of non-UC; p < 0.001). Correspondingly, lower percentages identifying as Black/African American only in both groups (7.5% and 7.0%, respectively, vs. 12.3–12.4% among comparators). For BMI, there was no significant difference in the distribution between the CD and non-CD groups (p = 0.40) or between UC and non-UC groups (p = 0.48).
Both conditions showed substantially worse self-rated general health compared to their comparators, as only 6.5% of the CD group and 6.9% of the UC group reported their health as excellent, compared to 21.7% and 21.8% among the comparator groups, respectively (p < 0.001). Furthermore, 11.6% of the CD group and 12.6% of the UC group rated their health as poor in comparison to 3.3% and 3.2% of the comparators, respectively (both p < 0.001). Life satisfaction followed a similar pattern; however, statistical significance was only reached for UC (dissatisfied or very dissatisfied: 9.4% of UC vs. 4.1% of non-UC; p < 0.001) and only borderline significance for CD (5.9% vs. 4.1%; p = 0.07).
Comorbidity burden
For comorbidities, both the CD and UC groups showed a substantially higher unadjusted prevalence of almost every comorbidity examined in relation to their comparators (Table 1). Notable differences between the CD vs. non-CD and UC vs. non-UC groups included angina (4.7% vs. 1.6%; 7.1% vs. 1.5%), hepatitis (5.9% vs. 1.6%; 3.0% vs. 1.6%), COPD (11.1% vs. 4.2%; 13.6% vs. 4.2%), depression (33.2% vs. 18.7%; 34.6% vs. 18.6%), anxiety (30.2% vs. 18.4%; 33.7% vs. 18.3%), and colorectal cancer (2.0% vs. 0.5%; 1.7% vs. 0.5%). Arthritis was among the most prevalent comorbidities in both the CD group compared with the non-CD group (38.2% vs. 21.1%, p < 0.001) and the UC group compared with the non-UC group (45.9% vs. 20.9%, p < 0.001). Interestingly, the difference between the CD and non-CD groups for dyslipidemia (30.3% vs. 28.4%; p = 0.47) and diabetes mellitus (13.6% vs. 9.9%; p = 0.08) was not statistically significant, whereas both were significantly higher in prevalence in the UC group when compared to the non-UC group (45.0% vs. 28.2% and 16.4% vs. 9.8%, respectively; both p < 0.001).
Table 1. Clinical and sociodemographic characteristics of participants with Crohn's disease and ulcerative colitis. (A) Crohn's disease
Characteristic
Total
(n = 62151)
CD
(n = 351)
Non-CD
(n = 61800)
Test
value
p
Participants, n (weighted %)
62151
351 (0.48)
61800 (99.52)
Male sex, n (%)
28442 (48.7)
159 (50.6)
28283 (48.7)
χ² = 0.32
0.57
Age, years, mean ± SD
48.2 ± 18.6
52.6 ± 17.8
48.2 ± 18.6
t = 3.74
<0.001
Race, n (%)
χ² = 12.34
0.03
White only
49741 (78.0)
301 (84.9)
49440 (77.9)
Black/African American only
6791 (12.3)
25 (7.5)
6766 (12.3)
Asian only
3587 (6.4)
11 (3.6)
3576 (6.4)
AIAN only
622 (0.9)
4 (1.1)
618 (0.9)
AIAN and any other group
561 (0.8)
7 (1.7)
554 (0.8)
Other single and multiple races
849 (1.6)
3 (1.2)
846 (1.6)
BMI category, n (%)
χ² = 2.98
0.40
Healthy weight
18867 (30.4)
109 (30.3)
18758 (30.4)
Obese
20313 (33.0)
124 (36.7)
20189 (32.9)
Overweight
21959 (35.0)
108 (30.8)
21851 (35.0)
Underweight
1012 (1.7)
10 (2.1)
1002 (1.7)
Self-rated general health, n (%)
χ² = 96.95
<0.001
Excellent
12348 (21.6)
28 (6.5)
12320 (21.7)
Very good
20835 (33.5)
88 (24.3)
20747 (33.6)
Good
18779 (29.9)
114 (36.6)
18665 (29.8)
Fair
7870 (11.6)
77 (21.0)
7793 (11.6)
Poor
2319 (3.3)
44 (11.6)
2275 (3.3)
Life satisfaction, n (%)
χ² = 6.96
0.07
Very satisfied
27303 (44.6)
131 (37.2)
27172 (44.7)
Satisfied
32106 (51.2)
196 (57.0)
31910 (51.2)
Dissatisfied
2236 (3.4)
18 (4.7)
2218 (3.4)
Very dissatisfied
506 (0.7)
6 (1.2)
500 (0.7)
Comorbidities, n (%)
Stroke
2379 (3.0)
26 (6.3)
2353 (3.0)
χ² = 12.09
<0.001
Angina
1207 (1.6)
16 (4.7)
1191 (1.6)
χ² = 14.08
<0.001
Coronary heart disease
3943 (4.9)
34 (9.1)
3909 (4.9)
χ² = 7.46
0.006
Dyslipidemia
20440 (28.4)
115 (30.3)
20325 (28.4)
χ² = 0.52
0.47
Hypertension
23357 (32.0)
156 (39.7)
23201 (32.0)
χ² = 7.64
0.006
Diabetes mellitus
7003 (9.9)
44 (13.6)
6959 (9.9)
χ² = 3.12
0.08
Cancer
8196 (10.0)
74 (16.8)
8122 (9.9)
χ² = 16.69
<0.001
Asthma
9162 (15.0)
81 (23.7)
9081 (14.9)
χ² = 14.80
<0.001
Psoriasis
1965 (2.9)
33 (8.2)
1932 (2.9)
χ² = 26.53
<0.001
Hepatitis
1199 (1.6)
24 (5.9)
1175 (1.6)
χ² = 34.24
<0.001
Depression
12136 (18.8)
114 (33.2)
12022 (18.7)
χ² = 29.21
<0.001
Anxiety
11567 (18.5)
107 (30.2)
11460 (18.4)
χ² = 21.95
<0.001
Arthritis
16455 (21.2)
157 (38.2)
16298 (21.1)
χ² = 41.25
<0.001
COPD
3468 (4.3)
45 (11.1)
3423 (4.2)
χ² = 24.16
<0.001
Colorectal cancer
458 (0.6)
10 (2.0)
448 (0.5)
χ² = 13.85
<0.001
Table 1 (continued). (B) Ulcerative colitis
Characteristic
UC
(n = 861)
Non-UC
(n = 61290)
Test
value
p
Participants, n (weighted %)
861 (1.21)
61290 (98.79)
Male sex, n (%)
317 (40.8)
28125 (48.8)
χ² = 14.57
<0.001
Age, years, mean ± SD
56.8 ± 17.3
48.1 ± 18.6
t = 11.76
<0.001
Race, n (%)
χ² = 35.31
<0.001
White only
753 (86.3)
48988 (77.9)
Black/African American only
56 (7.0)
6735 (12.4)
Asian only
28 (3.7)
3559 (6.4)
AIAN only
5 (0.4)
617 (1.0)
AIAN and any other group
12 (1.6)
549 (0.8)
Other single and multiple races
7 (1.0)
842 (1.6)
BMI category, n (%)
χ² = 2.47
0.48
Healthy weight
260 (30.3)
18607 (30.4)
Obese
270 (31.3)
20043 (33.0)
Overweight
310 (36.1)
21649 (35.0)
Underweight
21 (2.3)
991 (1.7)
Self-rated general health, n (%)
χ² = 316.24
<0.001
Excellent
62 (6.9)
12286 (21.8)
Very good
175 (19.0)
20660 (33.7)
Good
308 (37.1)
18471 (29.8)
Fair
205 (24.3)
7665 (11.5)
Poor
111 (12.6)
2208 (3.2)
Life satisfaction, n (%)
χ² = 73.54
<0.001
Very satisfied
283 (31.6)
27020 (44.8)
Satisfied
499 (59.0)
31607 (51.1)
Dissatisfied
64 (8.1)
2172 (3.4)
Very dissatisfied
15 (1.3)
491 (0.7)
Comorbidities, n (%)
Stroke
80 (8.8)
2299 (2.9)
χ² = 62.63
<0.001
Angina
63 (7.1)
1144 (1.5)
χ² = 106.65
<0.001
Coronary heart disease
110 (10.3)
3833 (4.8)
χ² = 41.28
<0.001
Dyslipidemia
406 (45.0)
20034 (28.2)
χ² = 79.97
<0.001
Hypertension
434 (44.9)
22923 (31.8)
χ² = 50.99
<0.001
Diabetes mellitus
150 (16.4)
6853 (9.8)
χ² = 30.81
<0.001
Cancer
200 (19.7)
7996 (9.9)
χ² = 75.52
<0.001
Asthma
195 (22.0)
8967 (14.9)
χ² = 23.13
<0.001
Psoriasis
76 (9.7)
1889 (2.8)
χ² = 76.47
<0.001
Hepatitis
35 (3.0)
1164 (1.6)
χ² = 12.74
<0.001
Depression
302 (34.6)
11834 (18.6)
χ² = 86.94
<0.001
Anxiety
291 (33.7)
11276 (18.3)
χ² = 89.20
<0.001
Arthritis
448 (45.9)
16007 (20.9)
χ² = 194.09
<0.001
COPD
138 (13.6)
3330 (4.2)
χ² = 116.95
<0.001
Colorectal cancer
19 (1.7)
439 (0.5)
χ² = 16.49
<0.001
Sociodemographic, clinical, and comorbidity characteristics of United States adults according to history of Crohn's disease and ulcerative colitis, NHIS 2023–2024. Categorical variables are presented as unweighted frequencies (n) with survey-weighted percentages; continuous variables are presented as survey-weighted means ± standard deviation. Respondents with a self-reported history of Crohn's disease (CD) are compared against all respondents without a reported CD diagnosis (non-CD), and respondents with a self-reported history of ulcerative colitis (UC) are compared separately against all respondents without a reported UC diagnosis (non-UC); the two case groups are not mutually exclusive. Estimates incorporate NHIS sampling weights, strata, and primary sampling units to account for the complex survey design. P-values reflect survey-adjusted (design-based Wald) chi-square tests for categorical variables and survey-adjusted t-tests for continuous variables. Percentages may not total 100% because of rounding. AIAN, American Indian/Alaska Native; BMI, body mass index; COPD, chronic obstructive pulmonary disease; SD, standard deviation.
Factors independently associated with Crohn's disease
In univariate regression analysis, neither female gender (OR 0.93, 95% CI 0.71–1.21, p = 0.57) nor BMI category showed significant association with CD (Table 2). Across the comorbidities examined, 13 showed significantly higher crude odds of CD, with the strongest associations among all 13 being observed for hepatitis (OR 3.85, 95% CI 2.45–6.06), colorectal cancer (OR 3.65, 95% CI 1.84–7.22), angina (OR 3.09, 95% CI 1.71–5.58), psoriasis (OR 3.03, 95% CI 1.98–4.62), and COPD (OR 2.82, 95% CI 1.86–4.27). Diabetes and dyslipidemia were not statistically significant in the univariate regression analysis.
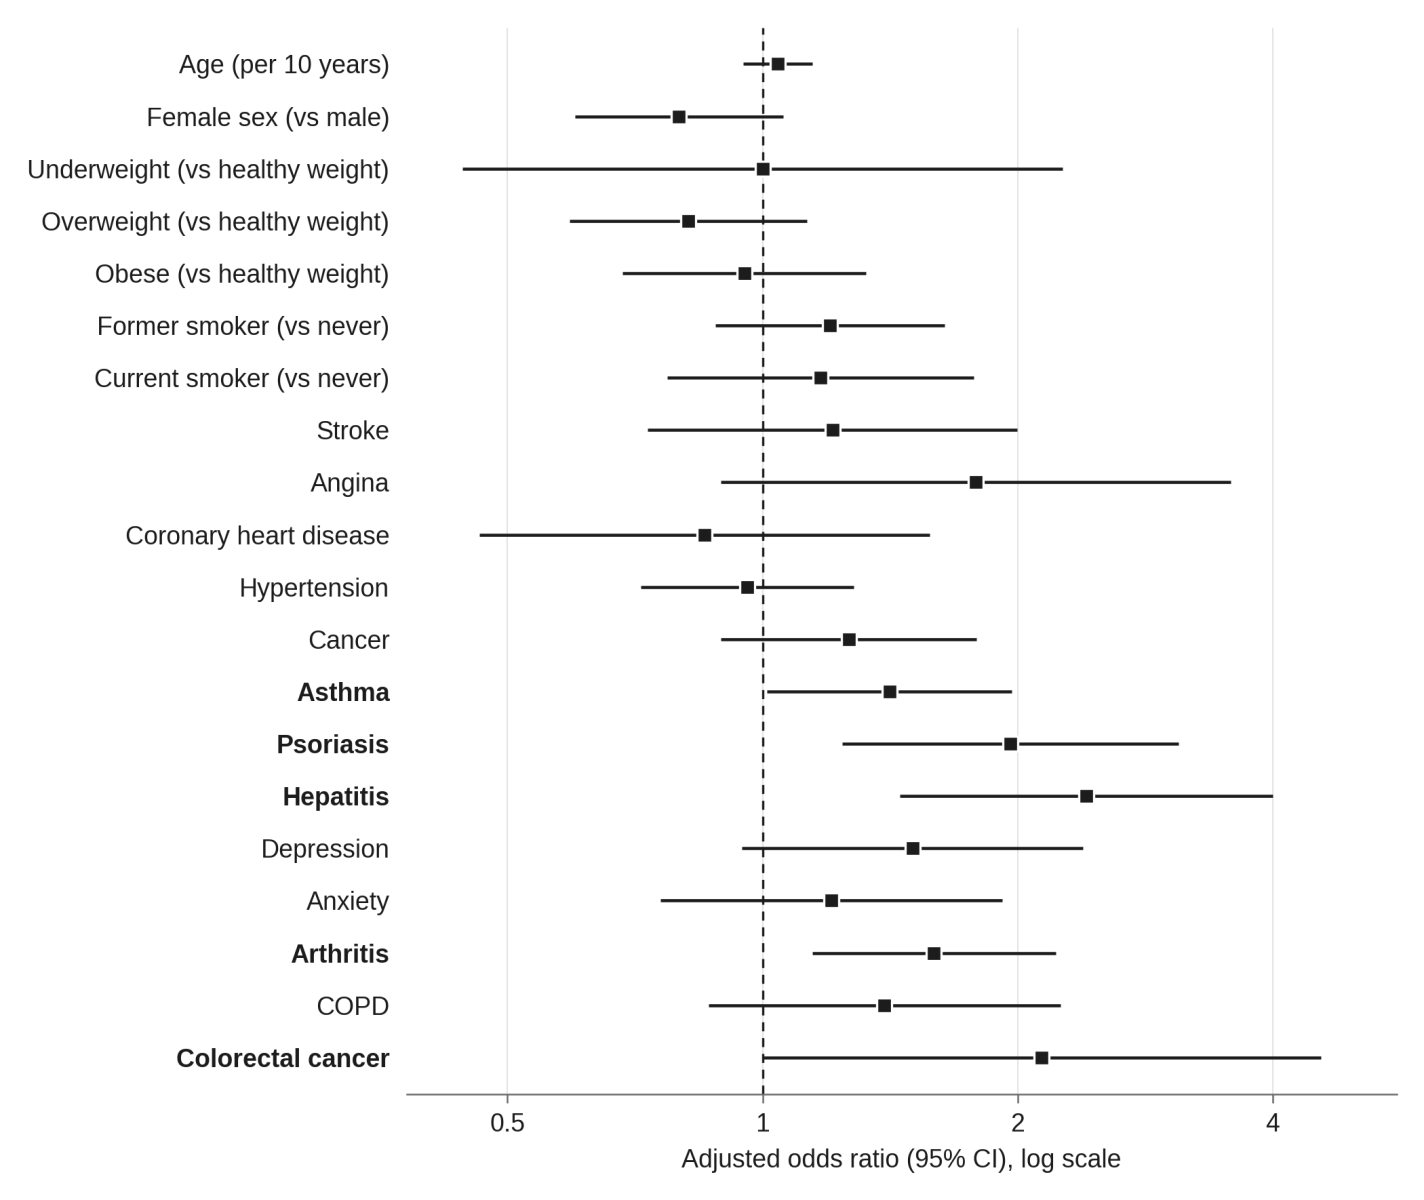
After adjustment with multivariate regression analysis (Table 3, Figure 1), most of the associations described were attenuated, and some lost statistical significance: stroke, angina, coronary heart disease, hypertension, cancer, depression, anxiety, and COPD. Only five comorbidities across all included conditions remained independently associated with CD after adjustment, which are asthma (aOR 1.41, 95% CI 1.01–1.97, p = 0.04), psoriasis (aOR 1.96, 95% CI 1.24–3.10, p = 0.004), hepatitis (aOR 2.41, 95% CI 1.45–4.00, p < 0.001), arthritis (aOR 1.59, 95% CI 1.14–2.22, p = 0.006), and colorectal cancer (aOR 2.14, 95% CI 1.00–4.56, p = 0.0498).
Table 2. Univariate analysis of factors associated with Crohn's disease
Variable
OR
95% CI
p
Sex
Male
Reference
Female
0.93
0.71–1.21
0.57
BMI category
Healthy weight
Reference
Underweight
1.30
0.61–2.75
0.50
Overweight
0.88
0.64–1.21
0.43
Obese
1.12
0.82–1.53
0.48
Comorbidities
Stroke
2.19
1.41–3.41
<0.001
Angina
3.09
1.71–5.58
<0.001
Coronary heart disease
1.95
1.21–3.14
0.006
Dyslipidemia
1.10
0.85–1.42
0.47
Hypertension
1.40
1.10–1.78
0.006
Diabetes mellitus
1.44
0.96–2.15
0.08
Cancer
1.83
1.37–2.45
<0.001
Asthma
1.77
1.32–2.37
<0.001
Psoriasis
3.03
1.98–4.62
<0.001
Hepatitis
3.85
2.45–6.06
<0.001
Depression
2.16
1.63–2.86
<0.001
Anxiety
1.91
1.46–2.51
<0.001
Arthritis
2.31
1.79–2.98
<0.001
COPD
2.82
1.86–4.27
<0.001
Colorectal cancer
3.65
1.84–7.22
<0.001
Univariate (crude) logistic regression analysis of sociodemographic and comorbidity factors associated with Crohn's disease. Values are unadjusted odds ratios (OR) with 95% confidence intervals (CI) and p-values, estimated from separate survey-weighted logistic regression models for each factor, comparing respondents with a self-reported history of Crohn's disease to all respondents without that diagnosis (n = 62,151). Reference categories were male sex, healthy weight (for body mass index category), and absence of each respective comorbidity. BMI, body mass index; COPD, chronic obstructive pulmonary disease.
Table 3. Multivariate analysis of factors associated with Crohn's disease
Variable
aOR
95% CI
p
Age (per 10 years)
1.04
0.95–1.15
0.38
Sex
Male
Reference
Female
0.80
0.60–1.06
0.12
BMI category
Healthy weight
Reference
Underweight
1.00
0.44–2.26
1.00
Overweight
0.82
0.59–1.13
0.22
Obese
0.95
0.68–1.32
0.77
Smoking status
Never
Reference
Former
1.20
0.88–1.64
0.25
Current
1.17
0.77–1.78
0.46
Comorbidities
Stroke
1.21
0.73–2.00
0.46
Angina
1.79
0.89–3.57
0.10
Coronary heart disease
0.85
0.46–1.58
0.61
Hypertension
0.96
0.72–1.28
0.78
Cancer
1.26
0.89–1.79
0.19
Asthma
1.41
1.01–1.97
0.04
Psoriasis
1.96
1.24–3.10
0.004
Hepatitis
2.41
1.45–4.00
<0.001
Depression
1.50
0.95–2.39
0.09
Anxiety
1.21
0.76–1.92
0.43
Arthritis
1.59
1.14–2.22
0.006
COPD
1.39
0.86–2.25
0.17
Colorectal cancer
2.14
1.00–4.56
0.0498
Multivariable logistic regression analysis of factors independently associated with Crohn's disease. Values are adjusted odds ratios (aOR) with 95% CI from a survey-weighted multivariable logistic regression model including age, sex, body mass index category, smoking status, and the comorbidities shown (n = 60,357; respondents with missing smoking status excluded). Dyslipidemia and diabetes mellitus were not significantly associated with Crohn's disease in univariable analysis and were not entered. Reference categories were male sex, healthy weight, never smoking, and absence of each respective comorbidity. Bold values indicate p < 0.05. BMI, body mass index; COPD, chronic obstructive pulmonary disease.
Figure 1. Multivariable logistic regression analysis of factors associated with Crohn's disease. Forest plot of adjusted odds ratios (aOR) with 95% CI for age, sex, body mass index category, smoking status, and each comorbidity entered, from the multivariable model summarized in Table 3. Squares indicate point estimates of the aOR; horizontal lines indicate 95% CI. The dashed vertical line marks no association (aOR = 1). Reference categories were male sex, healthy weight, never smoking, and absence of each respective comorbidity. Bold text indicates p < 0.05.
Factors independently associated with ulcerative colitis
In univariate analysis of the factors associated with ulcerative colitis, female sex was significantly associated with higher odds of UC (OR 1.38, 95% CI 1.17–1.63, p < 0.001), while BMI category showed no significant crude association (Table 4). For comorbidities, all 15 included comorbid conditions were significantly associated with UC before adjustment (all p < 0.001), the strongest crude associations being with angina (OR 4.95, 95% CI 3.65–6.71), stroke (OR 3.22, 95% CI 2.41–4.30), psoriasis (OR 3.70, 95% CI 2.76–4.97), COPD (OR 3.63, 95% CI 2.87–4.59), and arthritis (OR 3.21, 95% CI 2.72–3.78).
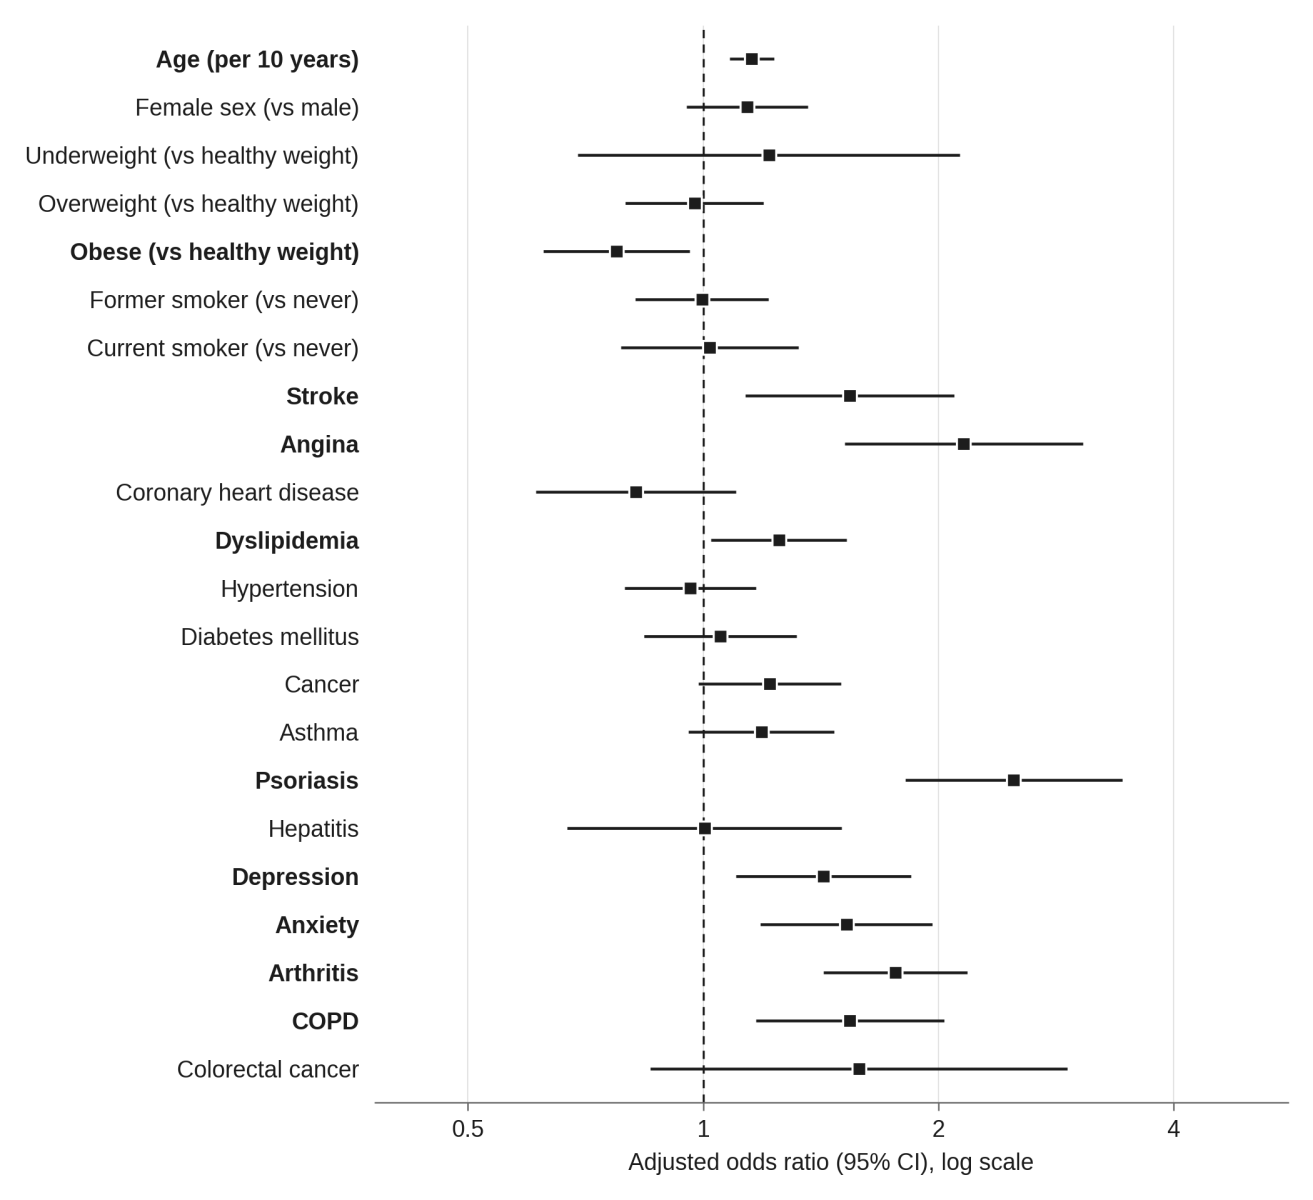
Following multivariate adjustment (Table 5, Figure 2), eight out of the fifteen examined comorbidities remained significantly associated with UC: stroke (aOR 1.54, 95% CI 1.13–2.09, p = 0.006), angina (aOR 2.16, 95% CI 1.52–3.06, p < 0.001), dyslipidemia (aOR 1.25, 95% CI 1.02–1.53, p = 0.03), psoriasis (aOR 2.50, 95% CI 1.81–3.44, p < 0.001), depression (aOR 1.42, 95% CI 1.10–1.84, p = 0.007), anxiety (aOR 1.53, 95% CI 1.18–1.97, p = 0.001), arthritis (aOR 1.76, 95% CI 1.43–2.18, p < 0.001), and COPD (aOR 1.54, 95% CI 1.17–2.03, p = 0.002). Cancer, coronary heart disease, hypertension, diabetes, asthma, hepatitis, and colorectal cancer lost significance after multivariable adjustment. The association with female gender was attenuated after adjustment and was no longer statistically significant (aOR 1.14, 95% CI 0.95–1.36, p = 0.15). Obesity showed an independent association with lower odds of UC in relation to the healthy weight BMI category (aOR 0.77, 95% CI 0.62–0.96, p = 0.02), whereas the underweight category showed no significant association (aOR 1.21, 95% CI 0.69–2.13).
Table 4. Univariate analysis of factors associated with ulcerative colitis
Variable
OR
95% CI
p
Sex
Male
Reference
Female
1.38
1.17–1.63
<0.001
BMI category
Healthy weight
Reference
Underweight
1.40
0.82–2.42
0.22
Overweight
1.04
0.85–1.26
0.73
Obese
0.95
0.78–1.16
0.63
Comorbidities
Stroke
3.22
2.41–4.30
<0.001
Angina
4.95
3.65–6.71
<0.001
Coronary heart disease
2.26
1.76–2.90
<0.001
Dyslipidemia
2.08
1.77–2.45
<0.001
Hypertension
1.74
1.50–2.03
<0.001
Diabetes mellitus
1.81
1.47–2.23
<0.001
Cancer
2.25
1.87–2.70
<0.001
Asthma
1.61
1.33–1.96
<0.001
Psoriasis
3.70
2.76–4.97
<0.001
Hepatitis
1.93
1.34–2.77
<0.001
Depression
2.32
1.94–2.77
<0.001
Anxiety
2.27
1.92–2.70
<0.001
Arthritis
3.21
2.72–3.78
<0.001
COPD
3.63
2.87–4.59
<0.001
Colorectal cancer
3.20
1.82–5.61
<0.001
Univariate (crude) logistic regression analysis of sociodemographic and comorbidity factors associated with ulcerative colitis. Values are unadjusted odds ratios (OR) with 95% CI and p-values, estimated from separate survey-weighted logistic regression models for each factor, comparing respondents with a self-reported history of ulcerative colitis to all respondents without that diagnosis (n = 62,151). Reference categories were male sex, healthy weight (for body mass index category), and absence of each respective comorbidity. BMI, body mass index; COPD, chronic obstructive pulmonary disease.
Table 5. Multivariate analysis of factors associated with ulcerative colitis
Variable
aOR
95% CI
p
Age (per 10 years)
1.15
1.08–1.23
<0.001
Sex
Male
Reference
Female
1.14
0.95–1.36
0.15
BMI category
Healthy weight
Reference
Underweight
1.21
0.69–2.13
0.50
Overweight
0.97
0.80–1.19
0.80
Obese
0.77
0.62–0.96
0.02
Smoking status
Never
Reference
Former
1.00
0.82–1.21
0.97
Current
1.02
0.78–1.32
0.89
Comorbidities
Stroke
1.54
1.13–2.09
0.006
Angina
2.16
1.52–3.06
<0.001
Coronary heart disease
0.82
0.61–1.10
0.19
Dyslipidemia
1.25
1.02–1.53
0.03
Hypertension
0.96
0.79–1.17
0.70
Diabetes mellitus
1.05
0.84–1.32
0.66
Cancer
1.22
0.99–1.50
0.07
Asthma
1.19
0.96–1.47
0.12
Psoriasis
2.50
1.81–3.44
<0.001
Hepatitis
1.00
0.67–1.50
0.99
Depression
1.42
1.10–1.84
0.007
Anxiety
1.53
1.18–1.97
0.001
Arthritis
1.76
1.43–2.18
<0.001
COPD
1.54
1.17–2.03
0.002
Colorectal cancer
1.58
0.86–2.92
0.14
Multivariable logistic regression analysis of factors independently associated with ulcerative colitis. Values are adjusted odds ratios (aOR) with 95% CI from a survey-weighted multivariable logistic regression model including age, sex, body mass index category, smoking status, and the comorbidities shown (n = 60,357; respondents with missing smoking status excluded). Reference categories were male sex, healthy weight, never smoking, and absence of each respective comorbidity. Bold values indicate p < 0.05. BMI, body mass index; COPD, chronic obstructive pulmonary disease.
Figure 2. Multivariable logistic regression analysis of factors associated with ulcerative colitis. Forest plot of adjusted odds ratios (aOR) with 95% CI for age, sex, body mass index category, smoking status, and each comorbidity, from the multivariable model summarized in Table 5. Squares indicate point estimates of the aOR; horizontal lines indicate 95% CI. The dashed vertical line marks no association (aOR = 1). Reference categories were male sex, healthy weight, never smoking, and absence of each respective comorbidity. Bold text indicates p < 0.05.
Comparison summary
Following adjustment, psoriasis and arthritis were the only two comorbidities independently associated with both UC and CD. UC retained significant associations with more comorbid conditions compared to CD (eight vs. five comorbidities), including stroke, angina, dyslipidemia, depression, and anxiety, which were not independently associated with CD.
Discussion
Our nationally representative, cross-sectional analysis of data from the 2023–2024 NHIS found that both CD and UC are associated with a considerably higher burden of comorbid conditions compared with the general adult population; however, the two entities differ in the pattern of comorbidity associations after adjustment, with multisystemic involvement including cardiovascular, dermatologic, metabolic, rheumatologic, respiratory, and psychiatric conditions. Interestingly, UC retained associations with more comorbidities than CD after multivariate adjustment (eight vs. five), whereas the CD-specific comorbidity pattern narrowed down after adjustment to asthma, psoriasis, hepatitis, arthritis, and colorectal cancer.
The persistence of the psoriasis-IBD association after multivariate adjustment with both conditions aligns with a growing body of literature demonstrating that psoriasis and IBD share genetic susceptibility loci, namely IL23R, IL12B, and the 6p21 major histocompatibility complex region, and immunogenetic pathways overlap between the two (interleukin-23/T-helper-17 axis). As both psoriasis and IBD are managed with overlapping classes of medications, our finding of psoriasis being among the largest adjusted odds ratios for both CD and UC and persisting after adjustment supports the existing recommendations to screen patients with either dermatologic or gastrointestinal immune-mediated condition for the other [9]. Likewise, the association of arthritis with CD and UC has persisted after multivariable adjustment, as spondyloarthritis (axial or peripheral) is among the most known extraintestinal manifestations of IBD, with estimates of pooled prevalence ranging from 11 to 14% in systematically reviewed data [10], and was similarly pronounced in a large Danish national registry study, although some differences were noted in the frequency and timing of extraintestinal manifestations between CD and UC in that cohort [6].
As to the strong CD-specific association with hepatitis after adjustment, it is likely related to the well-documented predisposition of IBD to hepatobiliary issues, including the bidirectional association between CD and primary sclerosing cholangitis [11], as well as autoimmune and cholestatic liver disease generally and hepatotoxicity possibly resulting from immunosuppressive and biological therapy. Our cross-sectional, self-report design is unable to distinguish among the previously described mechanisms, and hepatobiliary surveillance among individuals with CD remains an important area for future research. In regard to colorectal cancer, its elevated odds are associated with CD and are directionally proportional to the established risk of colorectal cancer in association with chronic inflammation of the colon in IBD, and it aligns with and reinforces the current guideline recommendations for early and frequent screening with colonoscopy in this population [12].
In UC, a broader cardiovascular pattern is retained in the adjusted model, including associations that were significant with stroke, angina, and dyslipidemia. This pattern is consistent with the body of literature describing IBD (especially UC) as being associated with an increased risk of ischemic heart disease [13] and venous thromboembolisms [14]. These conditions are attributed to chronic systemic inflammation, endothelial dysfunction, and a prothrombotic state during periods of active disease. Furthermore, another finding is the attenuated association between UC and female gender, as in the unadjusted model, a higher UC prevalence was shown among women, but this association was no longer significant after adjustment for age, smoking, BMI, and comorbidities, suggesting that crude differences in gender can be substantially confounded by the higher unadjusted burden of chronic comorbid conditions such as arthritis, depression, anxiety, and other comorbidities among women in our sample, rather than reflecting a direct biological effect of sex on UC risk. This finding, however, merits future replication in disease-specific cohorts. Likewise, obesity showed an independent association with a lower adjusted odds ratio of UC despite having no crude association. This pattern contrasts with meta-analytic evidence, which linked obesity to higher CD risk but showed no consistent association between BMI and UC risk [15]. As our study is a retrospective analysis of cross-sectional data, it cannot establish whether the observed association reflects reverse causation, such as weight loss caused by the disease itself, or a genuine protective effect. Thus, prospective cohort studies are needed to confirm this association.
Our analysis has several limitations that should be considered. First, the cross-sectional design of our study cannot establish causality or temporality. Second, CD and UC status is based on self-reported diagnosis of either of the conditions without medical record or endoscopic confirmation, which may introduce misclassification. Third, the NHIS survey does not assess current disease activity, medication use, or disease duration and only captures lifetime “ever diagnosed” status, precluding analysis of comorbidity accrual over the course of illness. Fourth, CD and UC were each compared with respondents without the respective diagnosis rather than directly with each other, so differences between the two diseases were not formally tested, and the larger UC group gave those models greater statistical power to detect associations. Finally, the CD and UC groups were not mutually exclusive, as 86 of the participants reported both diagnoses, which reflects possible diagnostic overlap, disease reclassification, or reporting error and can potentially attenuate the differences between both groups.
Conclusion
In this study, we have found that both Crohn's disease and ulcerative colitis were associated with increased comorbidity burden relative to the general population, but the two entities displayed different patterns after adjustment. Ulcerative colitis retained significant associations with a broader range of cardiovascular and psychiatric conditions than Crohn's disease, whereas psoriasis and arthritis were identified as shared correlates of both entities. These findings support disease-specific approaches to screening and management of comorbidities in patients with inflammatory bowel disease, which should be confirmed in studies that compare the two diseases directly.
Declarations
Conflict of Interest: The authors have no conflict of interest to declare.
Funding: This research received no specific grant from any funding agency in the public, commercial, or not-for-profit sectors.
Authors Contribution: Conceptualization, H.M.A., M.A.; methodology, H.M.A.; validation, H.M.A., M.A., Y.N.A., Z.H.A., A.S.A., B.M.A., A.M.A., A.S.A., N.N.A, A.A.A.; formal analysis, H.M.A.; data curation, H.M.A., Y.N.A., Z.H.A.; writing – original draft preparation, H.M.A., Y.N.A., Z.H.A., A.S.A., B.M.A., A.M.A., A.S.A., N.N.A, A.A.A.; writing – review and editing, H.M.A., M.A., Y.N.A., Z.H.A., A.S.A., B.M.A., A.M.A., A.S.A., N.N.A, A.A.A.; supervision, M.A. All authors have read and agreed to the published version of the manuscript.
Informed Consent Statement: Informed consent was obtained from all subjects in the study.
Data Availability Statement: All data used in this study are available online in the NHIS website.
References
Gecse KB, Vermeire S. Differential diagnosis of inflammatory bowel disease: imitations and complications. Lancet Gastroenterol Hepatol. 2018;3(9):644–53. doi:10.1016/S2468-1253(18)30159-6
Ng SC, Shi HY, Hamidi N, Underwood FE, Tang W, Benchimol EI, et al. Worldwide incidence and prevalence of inflammatory bowel disease in the 21st century: a systematic review of population-based studies. Lancet. 2017;390(10114):2769–78. doi:10.1016/S0140-6736(17)32448-0
Dahlhamer JM, Zammitti EP, Ward BW, Wheaton AG, Croft JB. Prevalence of inflammatory bowel disease among adults aged ≥18 years — United States, 2015. MMWR Morb Mortal Wkly Rep. 2016;65(42):1166–9. doi:10.15585/mmwr.mm6542a3
Lewis JD, Parlett LE, Jonsson Funk ML, Brensinger C, Pate V, Wu Q, et al. Incidence, prevalence, and racial and ethnic distribution of inflammatory bowel disease in the United States. Gastroenterology. 2023;165(5):1197–1205.e2. doi:10.1053/j.gastro.2023.07.003
Xu F, Dahlhamer JM, Zammitti EP, Wheaton AG, Croft JB. Health-risk behaviors and chronic conditions among adults with inflammatory bowel disease — United States, 2015 and 2016. MMWR Morb Mortal Wkly Rep. 2018;67(6):190–5. doi:10.15585/mmwr.mm6706a4
Vadstrup K, Alulis S, Borsi A, Jørgensen TR, Nielsen A, Munkholm P, et al. Extraintestinal manifestations and other comorbidities in ulcerative colitis and Crohn disease: a Danish nationwide registry study 2003–2016. Crohns Colitis 360. 2020;2(3):otaa070. doi:10.1093/crocol/otaa070
Barberio B, Zamani M, Black CJ, Savarino EV, Ford AC. Prevalence of symptoms of anxiety and depression in patients with inflammatory bowel disease: a systematic review and meta-analysis. Lancet Gastroenterol Hepatol. 2021;6(5):359–70. doi:10.1016/S2468-1253(21)00014-5
National Center for Health Statistics. National Health Interview Survey [Internet]. Hyattsville (MD): Centers for Disease Control and Prevention; [cited 2026 Sep 2]. Available from: https://www.cdc.gov/nchs/nhis
Jauregui W, Abarca YA, Ahmadi Y, Menon VB, Zumárraga DA, Rojas Gomez MC, et al. Shared pathophysiology of inflammatory bowel disease and psoriasis: unraveling the connection. Cureus. 2024;16(9):e68569. doi:10.7759/cureus.68569
Karreman MC, Luime JJ, Hazes JMW, Weel AEAM. The prevalence and incidence of axial and peripheral spondyloarthritis in inflammatory bowel disease: a systematic review and meta-analysis. J Crohns Colitis. 2017;11(5):631–42. doi:10.1093/ecco-jcc/jjw199
Zheng D, Xu Q, Wu J, Gu Z, Chen J, Liu Y. Prevalence and bidirectional association between primary sclerosing cholangitis and Crohn's disease: a systematic review and meta-analysis. Gastroenterol Hepatol. 2025;48(8):502346. doi:10.1016/j.gastrohep.2025.502346
East JE, Gordon M, Nigam GB, Sinopoulou V, Bateman AC, Din S, et al. British Society of Gastroenterology guidelines on colorectal surveillance in inflammatory bowel disease. Gut. 2026;75(3):442–75. doi:10.1136/gutjnl-2025-335023
Feng W, Chen G, Cai D, Zhao S, Cheng J, Shen H. Inflammatory bowel disease and risk of ischemic heart disease: an updated meta-analysis of cohort studies. J Am Heart Assoc. 2017;6(8):e005892. doi:10.1161/JAHA.117.005892
Grainge MJ, West J, Card TR. Venous thromboembolism during active disease and remission in inflammatory bowel disease: a cohort study. Lancet. 2010;375(9715):657–63. doi:10.1016/S0140-6736(09)61963-2
Rahmani J, Kord-Varkaneh H, Hekmatdoost A, Thompson J, Clark C, Salehisahlabadi A, et al. Body mass index and risk of inflammatory bowel disease: a systematic review and dose-response meta-analysis of cohort studies of over a million participants. Obes Rev. 2019;20(9):1312–20. doi:10.1111/obr.12875
keywords
Crohn's disease; ulcerative colitis; inflammatory bowel disease; comorbidity; sociodemographic factors; National Health Interview Survey.